Universal connectivity
Connect IT, OT and IoT using OPC UA, Modbus, BACnet, MQTT / Sparkplug B, SNMP, web services and Mitsubishi Electric FA Connector.

INDUSTRIAL SOFTWARE / PLATFORM & AI
Explore GENESIS 11 visualization, MELSOFT MaiLab data analysis and MELSOFT VIXIO visual inspection, with individual features and deployment guidance.
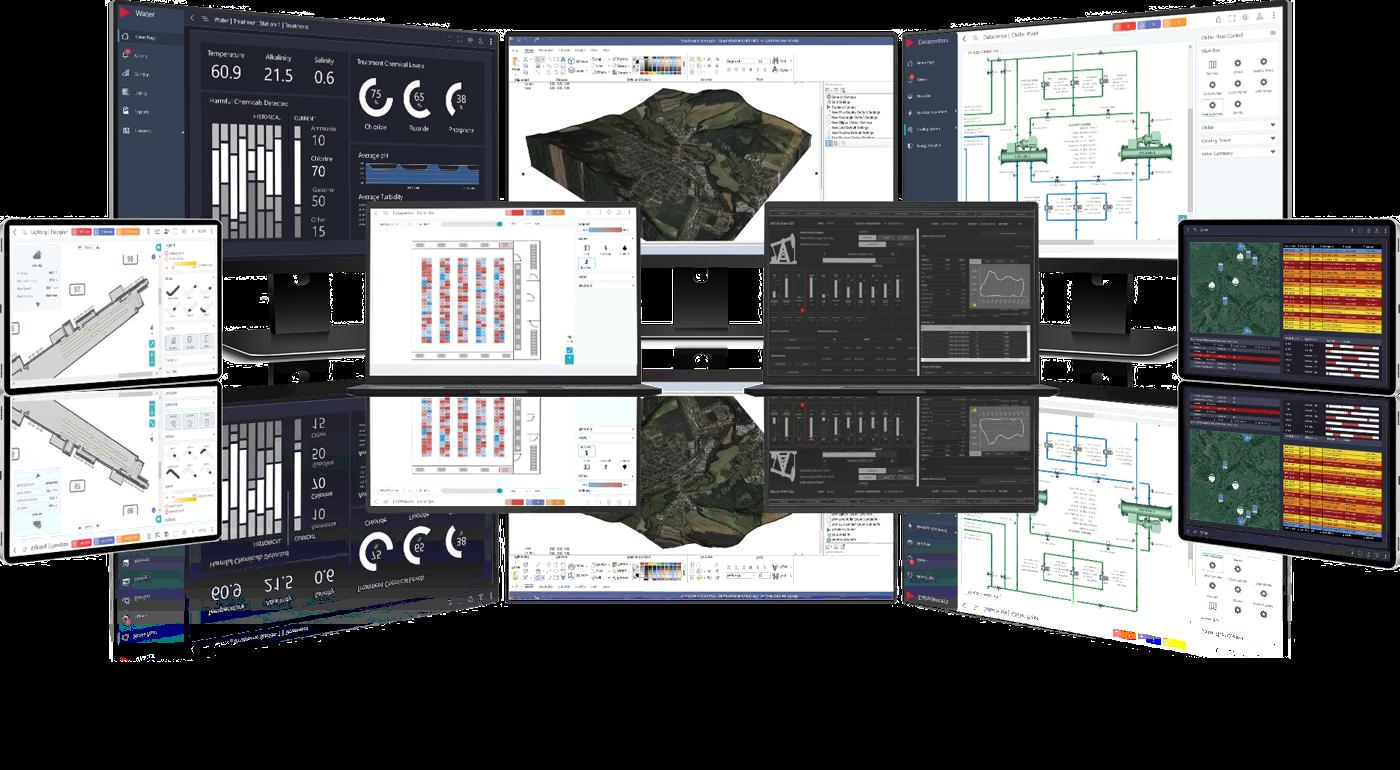
VISUALIZATION / OPERATION

Visual interfaces bring equipment and operating status into view.
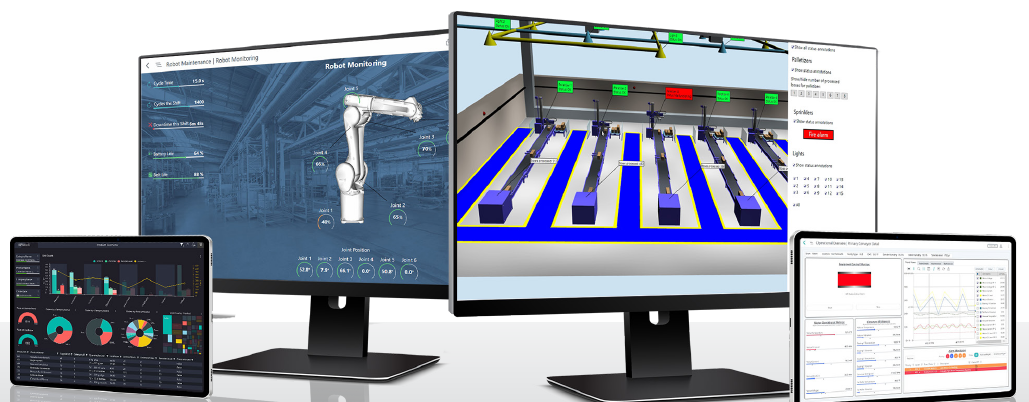
Desktop and mobile screens present equipment, trends and operational data.
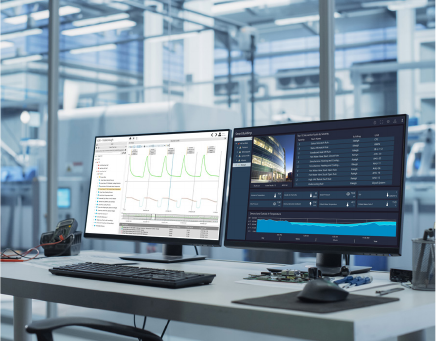
Review process data and alarms to support operational decisions.
ONE PLATFORM / MULTIPLE CAPABILITIES
Configure SCADA, industrial control and building management applications within one platform.
Connect IT, OT and IoT using OPC UA, Modbus, BACnet, MQTT / Sparkplug B, SNMP, web services and Mitsubishi Electric FA Connector.
GraphWorX creates 2D/3D displays and dashboards for desktop or HTML5 web access. MobileHMI supports iOS and Android.
Collect and retrieve time-series data, manage real-time and historical alarms, and generate Excel, PDF, HTML or CSV reports.
Scale from a single node to distributed architectures with redundancy, failover and load balancing. Services can span segmented networks or hybrid infrastructures.
Granular access control, encrypted communications, SAML 2.0, enterprise OIDC integration and audit logs support secure operations. Certified development processes include ISO 9001 and IEC 62443-4-1.
Subscription and perpetual options use node-based licensing rather than client, tag or historian point counts. Confirm license scope and support entitlements for the project.
MODULAR ARCHITECTURE
PLC · OPC UA · Modbus · MQTT
Assets · Historian · Alarms · Reports
Desktop · HTML5 · MobileHMI
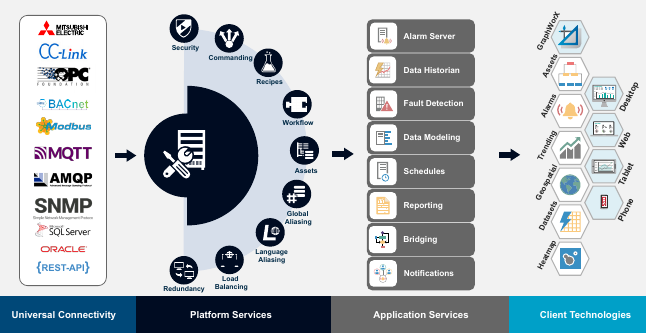
Connectivity, platform services, applications and clients work together.
View larger image ↗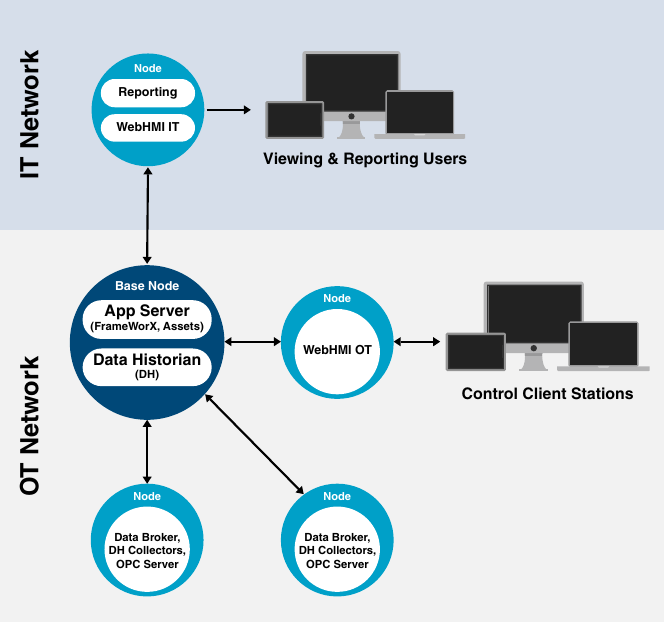
Deploy collection, historian, monitoring and reporting nodes across network zones.
View larger image ↗Plan node layout, network access, redundancy and permissions for the application. Capabilities and licensing depend on the project configuration.
DATA ANALYSIS / DIAGNOSIS
Data analysis and diagnosis software for machine waveforms and operation data, using visualization and AI-assisted modeling to create testable diagnostic rules.
View Chinese product catalog ↗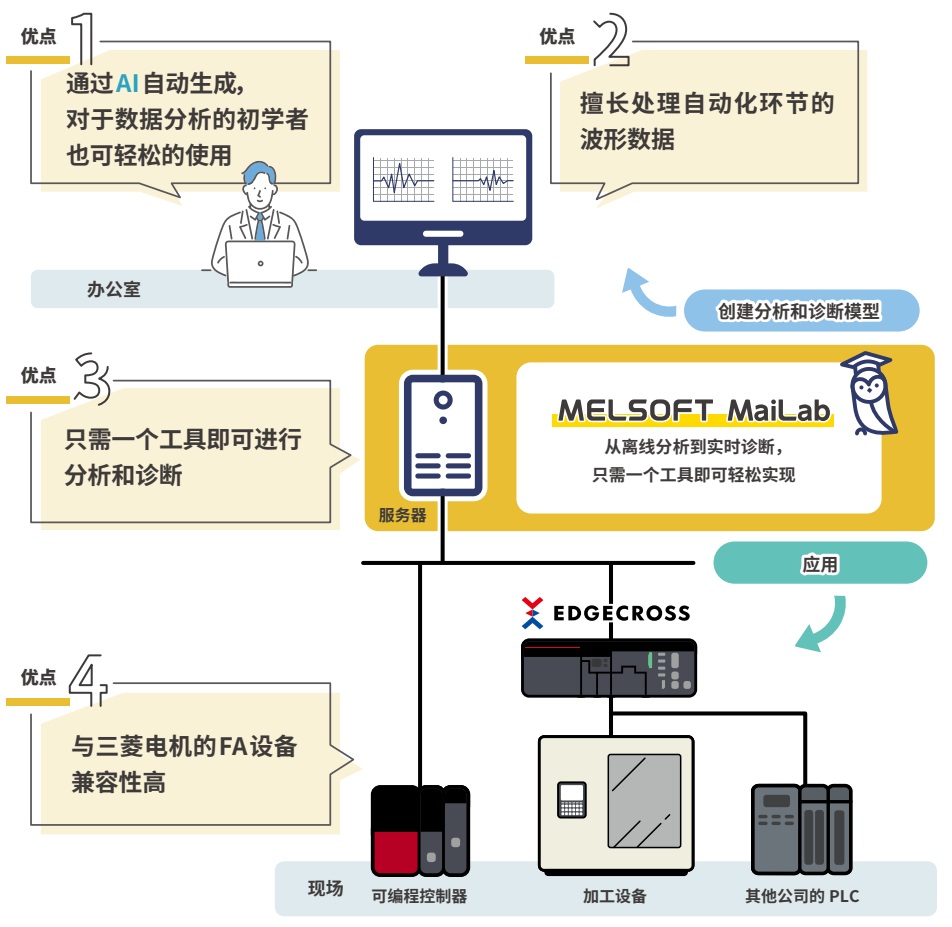
Create datasets from sources such as CSV / TSV and inspect line charts, scatter plots and correlation matrices.
Generate models according to analysis objectives and evaluate results using scores and contribution data. Validate model accuracy with site data.
Define tasks, data input/output and thresholds for real-time diagnosis and monitoring, including consumable condition and process analysis.
Results depend on data or image quality, site conditions and model validation. Confirm features, hardware and licensing in the catalog and manuals.
AI / VISUAL INSPECTION
AI visual inspection software for manufacturing, integrating model training, inspection tasks and monitoring screens in one tool.
View Chinese product catalog ↗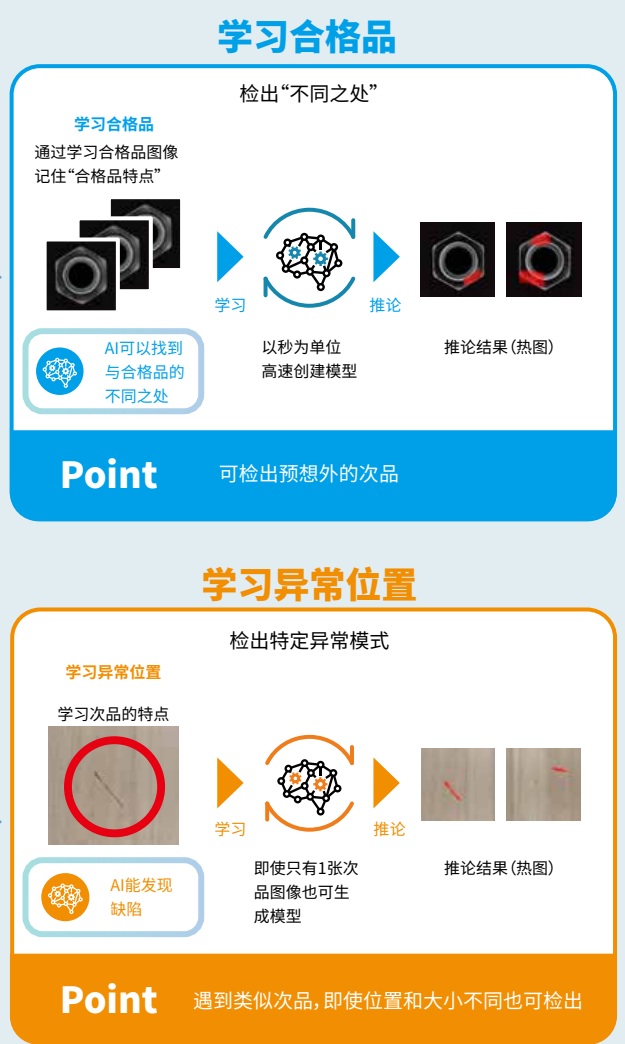
Learn good-product features to find differences, or learn anomaly locations for specific defects. Heatmaps help locate detected differences.
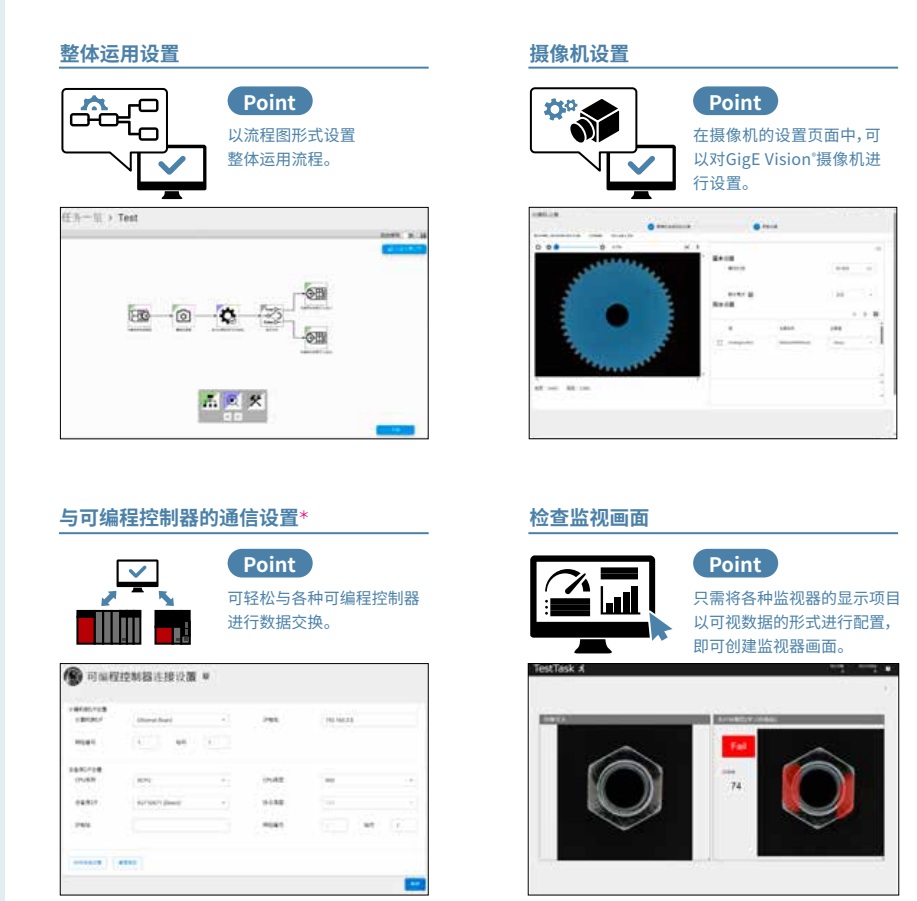
Configure workflows using flowcharts and set up cameras, PLC communication and monitoring in the same tool. Check supported interfaces and hardware.
Use inspection results and image records to investigate product quality. Development licenses support training and checks; runtime licenses support deployment and execution.
Results depend on data or image quality, site conditions and model validation. Confirm features, hardware and licensing in the catalog and manuals.
TALK TO SYSLINK
Tell us about your devices, protocols, dashboards and deployment requirements.